
It shows all the interactions that occurred in the detector. To visualize only the contribution of the searched particles, it needs to be processed.
The data collected in an experiment studying solar neutrinos can be visualised in a spectrum: a plot in which is reported the number of signals, received by the detector, as function of their energy. In the beginning, the spectrum shows usually all signals that occurred in the detector. In order to show only the spectrum of the signals one is looking for, one has to “clean” the original spectrum from signals due to background interactions (cosmic rays, environmental radiations and radioactive elements present in the material, which makes up the detector).
The spectrum obtained from the signals collected inside the Borexino detector is shown in Fig.1. The x-axis shows the particle energy, whereas the y-axis shows the number of particles detected per each value of energy over a given time period. The four figures represent various phases of spectrum “cleaning”. The second shows elimination of signals due to the passage of cosmic ray muons (see muon veto); ; the third shows the result after the removal of signals produced outside the so-called “fiducial volume”, the innermost volume of the detector where we can feel “confident” that unwanted interactions are minimal; the last figure represents the final spectrum obtained by removing the contribution of radioactive decays of inner contaminants (see scintilator).
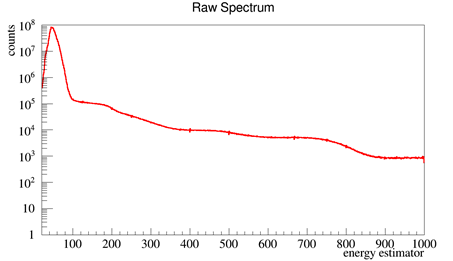
Fig.1 Observed Spectrum: number of interactions measured inside the detector as a function of energy.
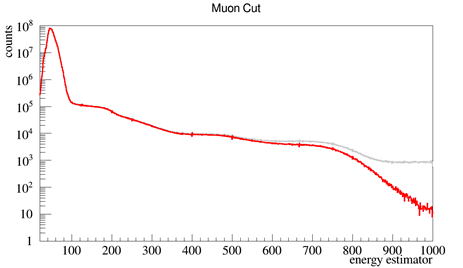
Fig.2 In grey initial spectrum of Fig.1); in red spectrum after cosmic ray muon removal (muons – link to muon veto page). The muons passing through the detector can themselves produce signals and activate other scintillator atoms that decay after short time.
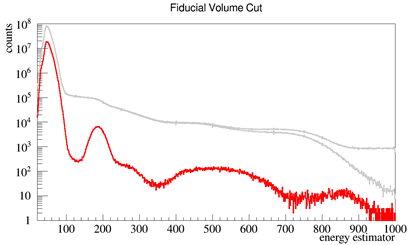
Fig.3 In red, the spectrum obtained by removing all the signals that occur outside the innermost region of the detector. The walls of the container of the detector and the other mechanical parts are in fact sources of radiation and only at a certain distance can extreme radio-purity conditions be obtained.
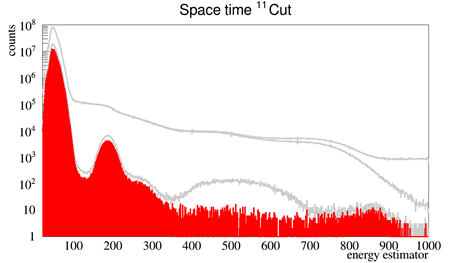
Fig.4 In red, the final spectrum, obtained by removing the signals generated by other correlated isotope decays such as carbon 11, activated by muons.

Discover the experiments and help the alien to get back home!
Play now